Wave Form Pictures
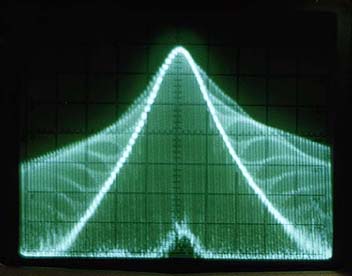
I recently purchased a spectrum analyzer , which shows the harmonic and wave emission characteristics of the devices wave. On this page, comparisons will be shown of the oscilloscope tracing, and the spectrum analyzer tracing. using 5,000 and 50,000 Hz square waves input to the CB. The CB is a modified Uniden PC 68 XL that will band pass to about 100,000 Hz. The CB has an unmodulated carrier wave of 4 watts and a square wave modulated output of about 38 watts. Output is AM, and is not gated carrier. A fairly well shaped pulse envelope is maintained to about 56,000 Hz. The CB ,without a linear amplifier was used. Measurements were taken about 10 feet from the tube.
Spectral Overview

The two primary sidebands are about 20 db down from the fundamental of 27.125 MHz. The majority of the harmonics are 60 db down from the fundamental and extend out to about 500 MHz. In other words the harmonics are of very weak intensity when compared to the fundamental. The fundamental is carrier wave only. Inside the sidebands , even the lower intensity harmonics produce some very unique looking wave forms which are shown below. The sidebands and harmonics essentially contain a series of square waves.
Oscilloscope and Spectrum Analyzer at 5 KHz


Above are the Oscilloscope scan on the left, and on the right the Spectrum Analyzer Scan.
Oscilloscope and Spectrum Analyzer at 50,000 Hz


Notice that each pulse is only 10 us ( 10 millionths ! ) of a second in width.
Spectrum Analyzer At 5,000 Hz

When the Spectrum Analyzer is set to show a very narrow bandwidth, the inside of the sidebands are revealed to be square waves .Each of the square wave harmonics shown within this sideband are 5000 Hz apart, but occur at different phase angels within the sideband. The energy of the harmonics can thus phase synchronize with the natural oscillation period of the cell/virus/ bacteria/etc.
Return To Home Page


